|
|
|
|
|
SLOT MACHINES STATISTICS
General
The Software export statistics, and keeps full history log, continuesly from casino’s starting date.
Machines are grouped by denomination, game type and location on the floor.
The user can see the history for a single machine, or extract statistics for machines grouped by denomination, type, or location for any selected period of time.
Data are imported from the Slot Machines system. The software is compatible with the IGT system and other online systems that store machine metrics in a database.
Statistics values are :
§ Win § Handle § Drop § Jackpots Payed § Hopper Fills § Actual Win Percentage § Theoretical Win Percentage § Number of Jackpots Payed § Games Played
Grouping the Machines
Grouping is done per denomination, and per machine type (Description).
Information for each machine are:
§ Machine number on floor § Game § Type § Theoretical Win Percentage § Denomination § Active (on floor) – Inactive (off floor) § Group
Statistics (List)
In the example below we have selected denomination 100, only the “on-floor” machines, from 18/12/97 to 12/5/98.
The columns from left to right:
§ Machine number § Game Description § Win § Handle § Drop § Jackpots Payed § Hopper Fills § Actual Win Percentage § Theoretical Win Percentage § Number of Jackpots Payed § Games Played
We can view this information in an asceding or descending order, according to any column.
The example above shows information in an asceding order according to the “Handle” column.
Statistics (Per group)
The user selects time period, and information type (Drop, Win etc, on the right of the screen).
The pie shows how the Slots win, devided per machine group.
The graph shows win, drop (in the same scale) and Actual Win Percentage (in another scale), per machine group.
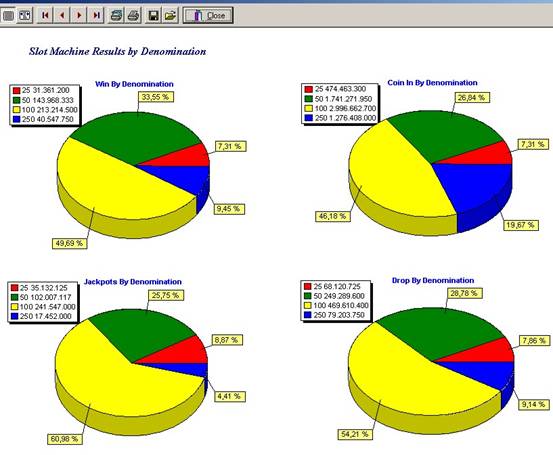
Statistics (Per Denomination)
Comperative per denomination of Coin in, Win, Jackpots, Hardcount, for a selected time period.
Statistics (Per Denomination)
The four pies show : Win, Coin In, Jackpots , Drop per denomination (red=25, green=50, yellow=100, blue=250)
In the fourth pie we see how Slots Drop is devided according to machine denomination.
|
|
Questions or problems regarding this web site
should be directed to [CompanyEmail]. |